Every electronics hobbyist knows the feeling. You have spent hours assembling a circuit, double-checked the schematic, uploaded the code, and powered it on. Nothing. No LEDs, no serial output, no sign of life. Your instinct is to start swapping components, wiggling wires, and uploading random code changes hoping something sticks. That approach rarely works, and when it does, you have no idea what actually fixed it — meaning the same problem will bite you again.
Debugging is a skill, and it can be learned systematically. In this guide, we will walk through a structured methodology for finding faults in electronics projects, from simple LED circuits to complex ESP32 and Arduino builds. By the end, you will have a repeatable process that turns frustrating hours of guesswork into focused, efficient troubleshooting.
Why Debugging Skill Matters More Than Building Skill
Here is an uncomfortable truth: the ability to debug is more valuable than the ability to build. Anyone can follow a tutorial and wire up a circuit on a breadboard. The real skill emerges when something goes wrong, because something always goes wrong.
Professional electronics engineers spend far more time debugging than designing. The difference between a beginner and an experienced maker is not that the expert's circuits work the first time. It is that when they fail, the expert finds the fault in minutes instead of days.
Debugging teaches you how circuits actually work. Every fault you track down deepens your understanding of voltage, current, timing, and signal integrity in ways that a hundred successful builds never will.
The Debugging Mindset
Before touching a single wire, adopt these principles:
- Be systematic, not random. Randomly swapping components is like trying to fix a car engine by replacing parts at random. You might get lucky, but you will waste time and money.
- Change one thing at a time. If you change three things and the circuit starts working, you do not know which change fixed it, and the other two changes might introduce new problems later.
- Write down what you observe. Memory is unreliable when you are frustrated. Keep notes of what you tried, what you measured, and what happened.
- Trust your instruments, not your assumptions. "I am sure that wire is connected" is not the same as measuring continuity with a multimeter.
- The fault is real and findable. Electronics follow the laws of physics. There is always a concrete, physical reason why something is not working.
The Five-Step Debugging Process
Step 1 — Observe: Define the Symptom Precisely
Before you fix anything, you need to know exactly what is broken. Vague descriptions like "it does not work" are useless. Ask yourself:
- What exactly is happening? The LED is dim instead of bright. The motor turns but slowly. The sensor returns -1 instead of a temperature value.
- What should be happening? The LED should be fully bright at 20mA. The motor should spin at 3000 RPM. The sensor should return 25.3 degrees Celsius.
- When did it stop working? Was it ever working? Did it break after a specific change?
- Is it consistent? Does it fail every time, or only sometimes?
Write the symptom down in one clear sentence: "The DHT22 sensor returns NaN on the ESP32 after approximately 30 seconds of operation, even though it works correctly for the first 30 seconds."
That sentence contains far more diagnostic information than "sensor broken."
Step 2 — Check the Obvious
80% of electronics faults are embarrassingly simple. Before diving deep, check these first:
| Check | How | Common Gotcha |
|---|---|---|
| Power supply voltage | Measure with multimeter at the load | USB cable too thin, voltage drops below 4.5V |
| Correct connections | Trace each wire from schematic to breadboard | Off-by-one row on the breadboard |
| Code uploaded correctly | Check serial output, verify board selection | Wrong COM port, wrong board variant selected |
| Component orientation | Check datasheet pinout | LED backwards, IC rotated 180 degrees |
| Breadboard contact | Wiggle wires, check for bent pins | Worn-out breadboard rows with weak spring contacts |
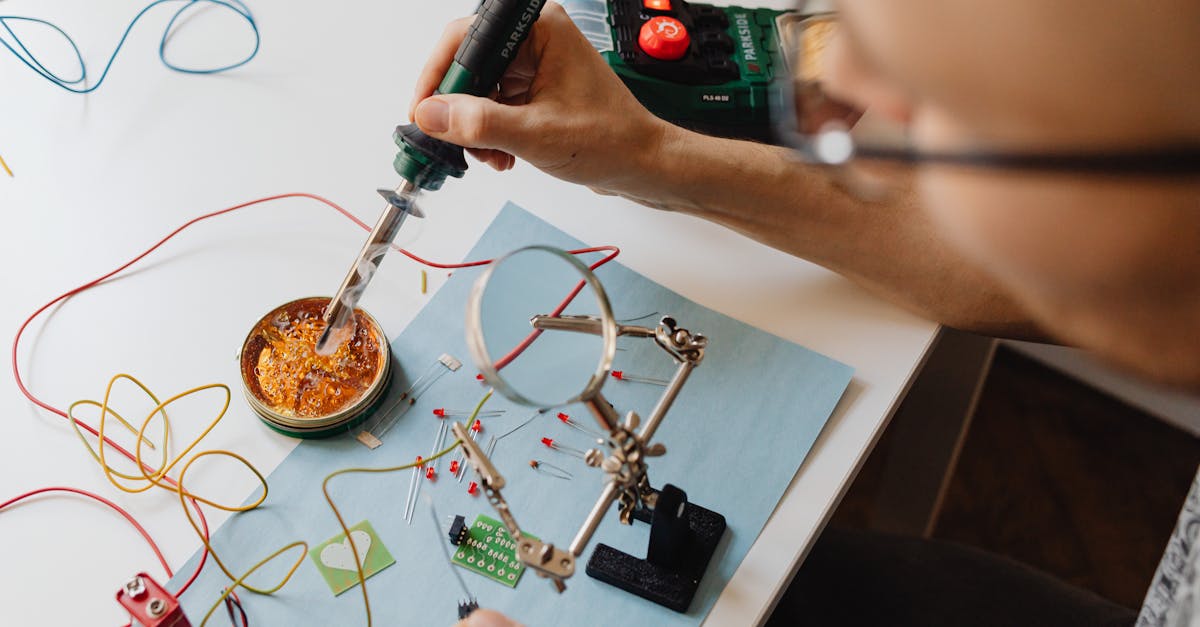
| Solder joints | Visual inspection, magnifying glass | Cold solder joints that look connected but are not |
Do not skip this step. Experienced engineers check power and ground first, every single time. It is not beneath you.
Step 3 — Divide and Conquer
If the obvious checks pass, isolate sections of the circuit and test each independently. This is the most powerful debugging technique.
For a project with an ESP32 reading a sensor and driving a display:
- Test the ESP32 alone. Does it boot? Does it output to Serial? Can you blink an LED?
- Test the sensor alone. Wire only the sensor to the ESP32. Does it return valid data?
- Test the display alone. Wire only the display. Can you draw a test pattern?
- Combine two at a time. Sensor + ESP32 working? Now add the display.
The fault lives in whichever section fails when tested alone, or in the interaction between sections when they are combined.
Step 4 — Measure
Your multimeter is your most important debugging tool. Stop guessing. Measure.
Voltage checks:
- Measure VCC at the power pin of every IC, not just at the power supply. Voltage can drop across long breadboard traces and thin jumper wires.
- Measure signal voltages. Is a "high" signal actually above the logic threshold? On a 3.3V ESP32, a "high" should be above 2.6V.
Continuity checks:
- Verify every connection from source to destination. Put one probe on the Arduino pin and the other on the component pin. You should hear a beep.
- Check for shorts between adjacent pins, especially on hand-soldered headers.
Current measurement:
- If a component is not working, measure the current flowing through it. A LED that draws 0mA has an open connection somewhere. A LED that draws 200mA has a missing resistor.
Step 5 — Compare
When you are stuck, comparison is your best friend:
- Known-good vs suspected-bad. If you have a second ESP32 or sensor, swap it in. If the problem disappears, the original component is faulty.
- Reference circuit vs your build. Go back to the datasheet example circuit and compare it wire-by-wire against your build. Missing pull-up resistor? Wrong capacitor value?
- Working code vs your code. Load a known working example sketch for your sensor. If the example works but your code does not, the fault is in software.
Common Fault Categories and Systematic Fixes
"Nothing Happens"
This is the most common complaint and usually the simplest to fix.
- Check power. Measure voltage at VCC and GND of your microcontroller. Is it within spec? Many USB cables only carry charge, not data, and some deliver less than 4.5V under load.
- Check connections. Use continuity mode to verify every wire. Pay special attention to ground connections — a floating ground causes bizarre behavior.
- Check code upload. Open Serial Monitor at the correct baud rate. Add
Serial.println("BOOT OK");as the first line insetup(). If you do not see it, the code is not running. - Check for shorts. Measure resistance between VCC and GND. It should not be near zero. A short circuit can prevent the voltage regulator from starting.
"Works Sometimes"
Intermittent faults are the most frustrating, but they have systematic causes:
- Loose connections. Gently wiggle each wire while the circuit runs. If the fault appears when you touch a specific wire, you have found it.
- Power supply droop. The circuit works until a motor or servo activates, pulling too much current and dropping the voltage below the microcontroller's minimum. Measure voltage while the load is active.
- Timing issues. The sensor needs 2 seconds to initialize, but your code reads it after 100ms. Add appropriate delays after power-on.
- Electrical noise. Long wires act as antennas, picking up interference. Shorten wires, add decoupling capacitors, and keep signal wires away from motor power wires.
"Wrong Readings"
Sensor returning garbage values?
- Wiring error. SDA and SCL swapped. Analog pin wrong. Verify every connection against the datasheet.
- Wrong reference voltage. An analog sensor designed for 5V will read incorrectly on a 3.3V ADC. Use a level shifter or voltage divider.
- Noise. Add a 100nF decoupling capacitor between VCC and GND at the sensor. Average multiple readings in software.
- Calibration. Some sensors need initial calibration. Check the datasheet for calibration procedures.
"Overheating"
If a component gets hot to the touch within seconds:
- Short circuit. Check for solder bridges or crossed wires. Measure resistance across the component.
- Wrong component value. A 10-ohm resistor where a 10k-ohm should be will pass 1000x the intended current.
- Exceeding ratings. Verify the voltage and current through the component against its datasheet maximum ratings.
- Disconnect power immediately and investigate before permanent damage occurs.
"Smoke or Burning Smell"
Disconnect power immediately. Then:
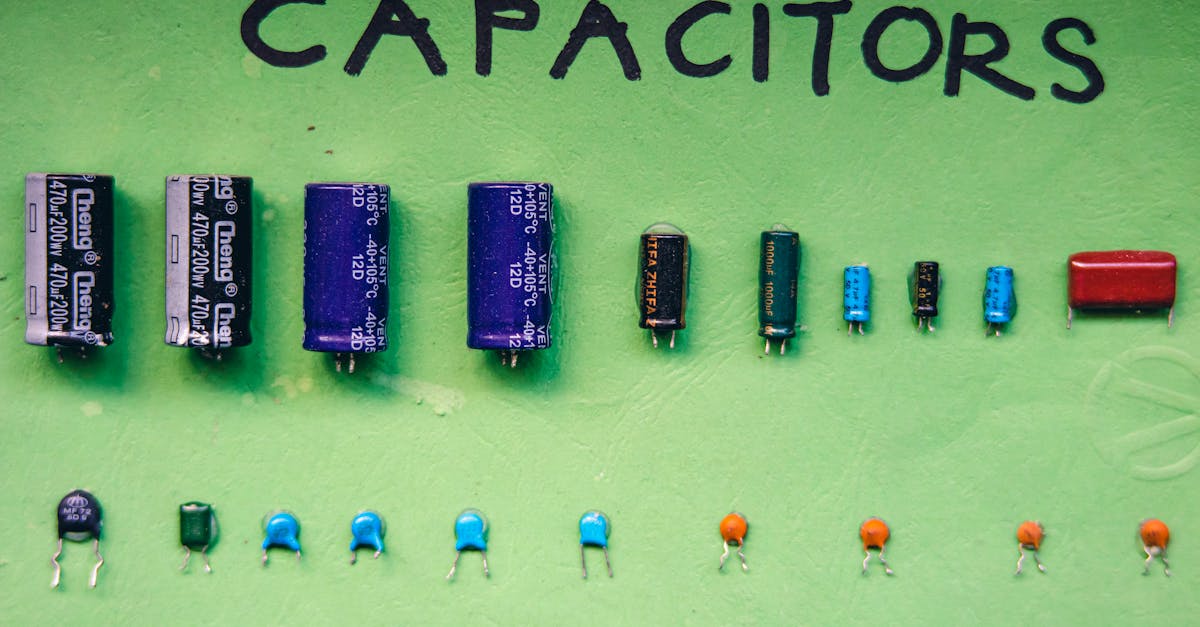
- Reverse polarity. Electrolytic capacitors and many ICs will be destroyed by reverse voltage. Check all polarized components.
- Exceeded voltage rating. Connecting 12V to a 5V rated component will release the magic smoke. Permanently.
- Short circuit on a high-current supply. A bench power supply can deliver enough current to melt traces and wires.
After identifying the cause, replace the damaged component. Do not assume other components survived — check everything in the affected section.
Tools for Debugging
Essential
| Tool | Use | Recommended |
|---|---|---|
| Multimeter | Voltage, current, continuity, resistance | UNI-T UT890D or equivalent |
| Serial Monitor | Software debug output from ESP32/Arduino | Built into Arduino IDE |
| LED + Resistor | Quick signal probe, power indicator | 3mm red LED + 1K resistor |
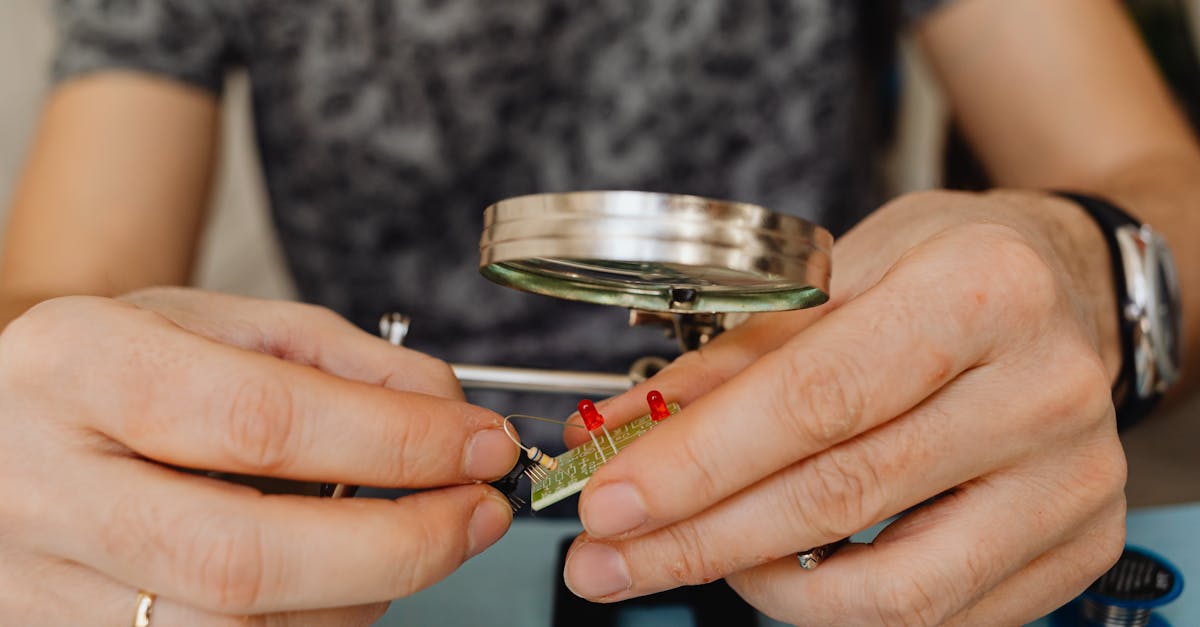
| Magnifying glass | Inspecting solder joints, PCB traces | 10x loupe or USB microscope |
Intermediate
| Tool | Use |
|---|---|
| Logic analyzer | Debugging I2C, SPI, UART timing issues |
| Oscilloscope | Visualizing signals, noise, power supply ripple |
| Bench power supply | Current-limited, adjustable voltage testing |
| Spare components | Quick swap testing for comparison |
The LED Probe
The simplest debugging tool is a LED with a series resistor. Touch it to any signal line to see if it is high or low. Touch it between VCC and GND to verify power. It is not precise, but it is fast and tells you instantly whether voltage is present.
Software Debugging on ESP32 and Arduino
Debug Logging Framework
Instead of scattering Serial.println() throughout your code, use a structured approach. Here is a minimal debug logging framework with severity levels:
// debug.h — Include in your project
#ifndef DEBUG_H
#define DEBUG_H

#define DEBUG_LEVEL 2  // 0=OFF, 1=ERROR, 2=WARN, 3=INFO, 4=DEBUG

#if DEBUG_LEVEL >= 1
  #define LOG_ERROR(msg) Serial.print("[ERROR] "); Serial.println(msg)
  #define LOG_ERRORF(fmt, ...) Serial.printf("[ERROR] " fmt "\n", __VA_ARGS__)
#else
  #define LOG_ERROR(msg)
  #define LOG_ERRORF(fmt, ...)
#endif

#if DEBUG_LEVEL >= 2
  #define LOG_WARN(msg) Serial.print("[WARN]  "); Serial.println(msg)
  #define LOG_WARNF(fmt, ...) Serial.printf("[WARN]  " fmt "\n", __VA_ARGS__)
#else
  #define LOG_WARN(msg)
  #define LOG_WARNF(fmt, ...)
#endif

#if DEBUG_LEVEL >= 3
  #define LOG_INFO(msg) Serial.print("[INFO]  "); Serial.println(msg)
  #define LOG_INFOF(fmt, ...) Serial.printf("[INFO]  " fmt "\n", __VA_ARGS__)
#else
  #define LOG_INFO(msg)
  #define LOG_INFOF(fmt, ...)
#endif

#if DEBUG_LEVEL >= 4
  #define LOG_DEBUG(msg) Serial.print("[DEBUG] "); Serial.println(msg)
  #define LOG_DEBUGF(fmt, ...) Serial.printf("[DEBUG] " fmt "\n", __VA_ARGS__)
#else
  #define LOG_DEBUG(msg)
  #define LOG_DEBUGF(fmt, ...)
#endif

#endif // DEBUG_H
Usage in your main sketch:
#include "debug.h"

void setup() {
  Serial.begin(115200);
  LOG_INFO("System booting...");

  if (!sensor.begin()) {
    LOG_ERROR("Sensor initialization failed!");
    return;
  }
  LOG_INFO("Sensor initialized OK");
}

void loop() {
  float temp = sensor.readTemperature();
  LOG_DEBUGF("Raw temperature: %.2f", temp);

  if (temp < -40 || temp > 125) {
    LOG_WARNF("Temperature out of range: %.2f", temp);
  }
}
When you are ready to ship, set DEBUG_LEVEL to 0 and all logging calls compile away to nothing, using zero flash or RAM.
LED Indicators for Headless Debugging
When Serial is not available (deployed device, no USB connection), use the onboard LED:
// Blink patterns for status indication
void blinkError() {    // Rapid blink = error
  for (int i = 0; i < 10; i++) {
    digitalWrite(LED_BUILTIN, !digitalRead(LED_BUILTIN));
    delay(100);
  }
}

void blinkHeartbeat() {  // Double pulse = running OK
  digitalWrite(LED_BUILTIN, HIGH); delay(100);
  digitalWrite(LED_BUILTIN, LOW);  delay(100);
  digitalWrite(LED_BUILTIN, HIGH); delay(100);
  digitalWrite(LED_BUILTIN, LOW);  delay(700);
}
Watchdog Timer
For ESP32 projects that hang unexpectedly, enable the watchdog timer to force a restart and print diagnostic information:
#include <esp_task_wdt.h>

void setup() {
  esp_task_wdt_init(10, true);  // 10-second timeout, panic on timeout
  esp_task_wdt_add(NULL);       // Watch the current task
  LOG_INFO("Watchdog enabled, 10s timeout");
}

void loop() {
  esp_task_wdt_reset();  // Feed the watchdog each loop iteration
  // ... your code ...
}
If your code hangs, the watchdog will reset the ESP32 and print a backtrace to Serial, showing you exactly where the hang occurred.
Debugging Common Communication Protocols
Debugging I2C
I2C problems are extremely common. Follow this checklist:
1. Run an I2C scanner first. This tells you which devices are actually responding:
#include <Wire.h>

void setup() {
  Serial.begin(115200);
  Wire.begin();  // Default SDA=21, SCL=22 on ESP32

  Serial.println("Scanning I2C bus...");
  for (byte addr = 1; addr < 127; addr++) {
    Wire.beginTransmission(addr);
    if (Wire.endTransmission() == 0) {
      Serial.printf("Device found at 0x%02X\n", addr);
    }
  }
  Serial.println("Scan complete.");
}
2. Check pull-up resistors. I2C requires pull-ups on both SDA and SCL. Many breakout boards include them, but if you have multiple boards on the same bus, you may have too many pull-ups (effectively too low a resistance). Use 4.7K ohm pull-ups for standard speed I2C.
3. Verify addresses. Some devices have configurable addresses via address pins. Check the datasheet. A common mistake: the datasheet lists the 7-bit address, but your code uses an 8-bit address (shifted left by one).
4. Check voltage levels. An I2C device rated for 5V logic may not recognize 3.3V signals from an ESP32. Use a level shifter.
Debugging SPI
SPI issues are often wiring mistakes:
| Signal | Common Problem |
|---|---|
| MOSI / MISO | Swapped between controller and peripheral. MOSI from controller goes to MOSI (or SDI) on the peripheral, not MISO. |
| SCLK | Wrong clock polarity or phase. Check the datasheet for SPI Mode (0, 1, 2, or 3). |
| CS (Chip Select) | Not pulled low. Some libraries manage CS automatically; others require manual control. |
| Clock speed | Too fast for the peripheral or for long wires. Start at 1 MHz and increase. |
Debugging Power Issues
Power problems cause more mysterious failures than any other category:
- Measure under load. A power supply might show 5.0V with no load but droop to 4.2V when your circuit draws current. Always measure voltage while the circuit is running.
- Decoupling capacitors. Place a 100nF ceramic capacitor between VCC and GND at every IC, as close as physically possible. This is not optional — it filters high-frequency noise that causes random resets and data corruption.
- Ripple. If you have an oscilloscope, measure the voltage ripple on your power rail. More than 100mV of ripple on a 3.3V supply can cause problems. Add bulk capacitance (100uF electrolytic) in addition to ceramic decoupling caps.
- Ground loops. When powering different parts of your circuit from different sources, make sure all grounds are connected at a single point.
The "It Works on the Bench but Not Deployed" Problem
Your project works perfectly on your desk. You install it in the field, and it fails within hours. Why?
EMI (Electromagnetic Interference). Your bench is electrically quiet. The deployment location has motors, fluorescent lights, or radio transmitters nearby that inject noise into your circuit. Solution: shielding, shorter wires, twisted pairs for signal lines, and ferrite beads on power and signal cables.
Temperature. Your bench is a comfortable 25 degrees Celsius. The deployment location hits 50 degrees in summer or drops below zero in winter. Components have temperature ratings. Capacitor values drift with temperature. Crystals shift frequency. Test your circuit in a temperature range matching the deployment environment.
Power quality. Your bench uses a clean USB power supply. The deployment location uses a cheap 12V adapter with massive ripple. Add proper voltage regulation and filtering to your design.
Vibration. Breadboard connections that are fine on a desk will fall apart with any vibration. Solder your final circuit onto perfboard or a custom PCB.
When to Ask for Help
You have followed the systematic process and still cannot find the fault. It is time to ask for help. Here is how to do it effectively:
- Describe the symptom precisely (Step 1 from above).
- List what you have already tried and what you measured.
- Share your schematic, not just a photo of tangled wires.
- Share your code, formatted and complete.
- Include photos of your actual build, well-lit and in focus.
Where to ask:
- Arduino Forum (forum.arduino.cc) for Arduino projects
- ESP32 Forum (esp32.com) for ESP32-specific issues
- Reddit communities like r/arduino and r/esp32
- Discord servers for electronics and maker communities
- Wavtron support (wavtron.in) for product-specific questions about components and tools purchased from us
Building Your Debugging Toolkit Checklist
Start with the essentials and add tools as your projects grow in complexity:
Starter Kit (under Rs. 2,000):
- Digital multimeter with continuity buzzer
- Assorted LEDs and 1K resistors (signal probes)
- Spare jumper wires and breadboard
- Magnifying glass or loupe
- Notebook and pen for logging observations
Intermediate Kit (under Rs. 5,000):
- Logic analyzer (8-channel, compatible with PulseView/sigrok)
- Bench power supply with current limiting
- Assorted decoupling capacitors (100nF, 10uF, 100uF)
- Spare microcontrollers (ESP32, Arduino Nano) for comparison testing
- Flush cutters and precision tweezers
Advanced Kit (under Rs. 15,000):
- Digital oscilloscope (even a basic single-channel DSO is a game-changer)
- USB microscope for PCB inspection
- Hot air rework station
- ESR meter for capacitor testing
- Thermal camera module for finding hot spots
Real Debugging Stories: 5 Scenarios Solved Step by Step
Scenario 1: ESP32 Reboots Every Few Minutes
Symptom: ESP32 runs fine for 2-8 minutes, then reboots. Serial output shows rst:0xc (SW_CPU_RESET).
Process:
- Observed the reboot timing was random, not fixed. Ruled out a simple timer overflow.
- Checked power: 4.9V at VIN, stable. Not power droop.
- Added watchdog logging. Backtrace pointed to a function making HTTP requests.
- Measured current draw during WiFi transmission: spiked to 350mA. The thin USB cable could not sustain it.
- Replaced the USB cable with a shorter, thicker one. Reboots stopped completely.
Root cause: Voltage drop across a cheap USB cable during WiFi transmission peaks.
Scenario 2: I2C Sensor Works Alone but Not with Display
Symptom: BME280 sensor reads correctly when wired alone. OLED display works alone. When both are connected, the sensor returns zeros.
Process:
- Ran I2C scanner with both connected: both addresses detected. So the bus is physically OK.
- Checked addresses: BME280 at 0x76, OLED at 0x3C. No conflict.
- Checked pull-ups: the OLED breakout has 4.7K pull-ups. The BME280 breakout also has 4.7K pull-ups. With both connected, effective pull-up is 2.35K. Too strong for long wires, but should be fine for a breadboard.
- Examined the code: both libraries initialized I2C with
Wire.begin(), but the display library calledWire.setClock(400000)(fast mode). The BME280 was unreliable at 400kHz. - Forced
Wire.setClock(100000)after both initializations. Both devices now work together.
Root cause: I2C clock speed too fast for the BME280 sensor, set by the display library.
Scenario 3: Motor Driver Overheating
Symptom: L298N motor driver becomes too hot to touch within 30 seconds. Motors barely spin.
Process:
- Measured motor supply voltage at the driver: 11.8V (12V nominal). OK.
- Measured motor current: 1.2A per motor. L298N is rated for 2A. Should be fine.
- Checked for shorts: no shorts found.
- Read the L298N datasheet more carefully. The chip has a 2V to 4V drop across the H-bridge transistors. With 12V in and 4V dropped, only 8V reaches the motors. That 4V drop at 1.2A means 4.8W of heat dissipation in the chip.
- Added a heatsink and small fan. For the next project, switched to a MOSFET-based motor driver (like the TB6612FNG) which drops only 0.5V.
Root cause: Normal behavior for the L298N. The bipolar transistor H-bridge has high voltage drop and heat dissipation by design.
Scenario 4: Analog Sensor Gives Noisy Readings
Symptom: Potentiometer connected to ESP32 ADC. Values fluctuate by plus or minus 200 counts even when the knob is not touched.
Process:
- Measured voltage at the ADC pin with a multimeter: steady 1.65V. So the noise is not in the analog signal.
- Researched ESP32 ADC: known to have nonlinearity and noise issues.
- Added a 100nF capacitor between the ADC pin and GND. Fluctuation reduced to plus or minus 50 counts.
- Added software averaging (16 samples). Fluctuation reduced to plus or minus 5 counts.
- For critical applications, switched to an external ADS1115 16-bit ADC over I2C. Rock-solid readings.
Root cause: ESP32's built-in ADC is inherently noisy. Hardware filtering (capacitor) plus software averaging is the standard solution.
Scenario 5: LED Strip Shows Wrong Colors
Symptom: WS2812B LED strip shows random flickering colors instead of the solid red programmed.
Process:
- Checked wiring: data pin connected to GPIO 13 on ESP32. Power supply 5V, adequate amperage.
- Checked code: FastLED library, correct LED count, correct pin number.
- Measured data signal voltage at the strip's input: 3.1V (ESP32 is 3.3V logic). WS2812B expects 5V logic. The datasheet specifies minimum high voltage of 0.7 times VDD, which is 3.5V. The 3.1V signal is below threshold.
- Added a level shifter (SN74HCT125) between ESP32 and LED strip data input. Clean, solid red.
- Alternative quick fix: powered the first LED from 3.3V instead of 5V, so its logic threshold matched the ESP32. Then its output (at 5V logic) drove the rest of the strip.
Root cause: Logic level mismatch. 3.3V ESP32 output was below the WS2812B minimum high voltage threshold at 5V VDD.
Conclusion
Debugging is not a talent — it is a process. Observe, check the obvious, divide and conquer, measure, and compare. Follow these steps methodically and you will find the root cause of any electronics fault.
The most important tool in your debugging toolkit is not your multimeter or oscilloscope. It is your willingness to slow down, be systematic, and resist the urge to randomly swap components. Trust the process, trust your instruments, and the fault will reveal itself.
Every bug you find makes you a better engineer. Every hour spent debugging teaches you more about electronics than ten hours of following tutorials. Embrace the process, build your toolkit, and remember: the fault is always real and always findable.
Need tools for your debugging toolkit? Browse multimeters, logic analyzers, and test equipment at wavtron.in.